Workout Wednesday Week 7 - Dynamic Trellis Chart
tableau WorkoutWednesday trellis-chart
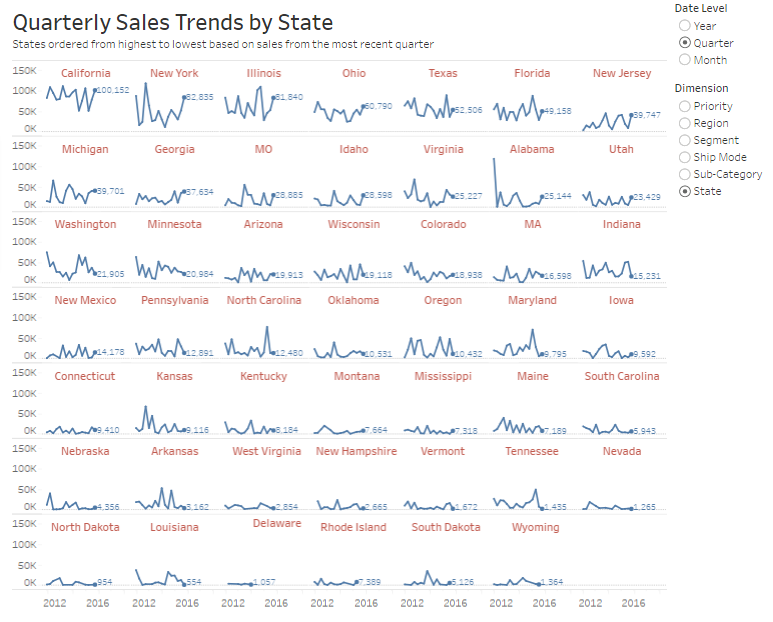
For Workout Wednesday week 7 the challenge was given by Andy Kriebel to build the below dynamic trellis chart using Superstore Sales data.
These were the recommended guidelines :
- The user should be able to choose the level of detail they want for the date.
- The date axis format should not change, irrespective of the date level chosen.
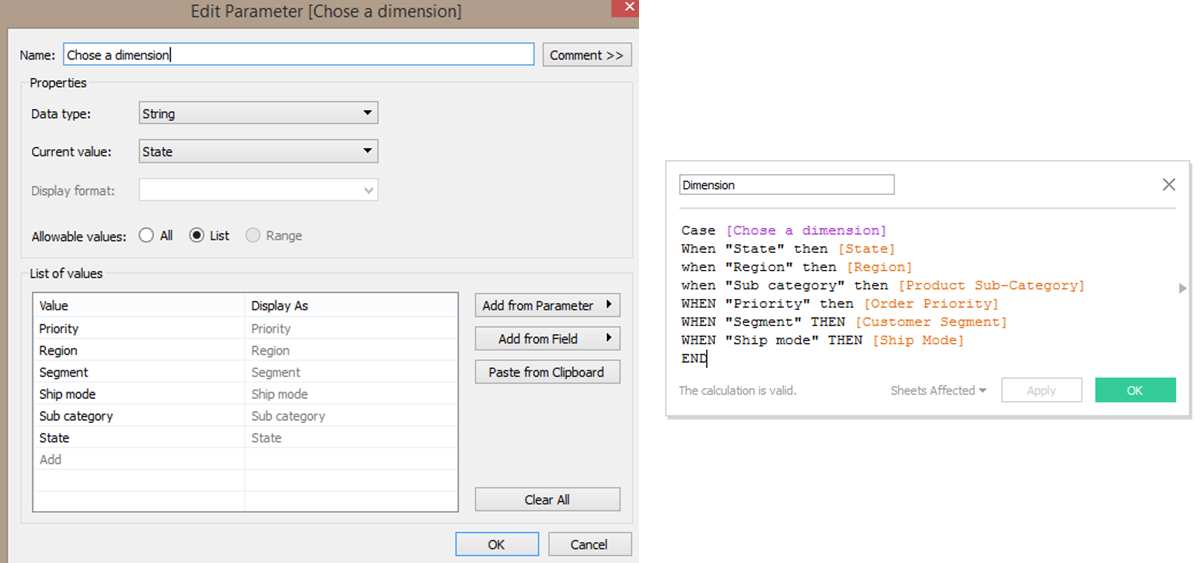
- The user should be able to pick from the list of dimensions shown.
- The dimensions should be sorted from upper left to lower right based on the sales in the most recent time period.
- Match the tooltips. Note that they change based on the options the user selects. Pay attention to the date formats in particular.
- The title should update dynamically based on the date level and dimension selected.
- The end of each line should be labeled to the right of the last point.
- There should be a little circle on the end of each line.
- Each section of the trellis should include a label for the value of the dimension for that section. E.g., California should be on the upper left when you selected quarters by state.
- The dimension labels should be centered in each section.
- There should be no gridlines, but the zero line should be included.
- Each row should should have a light divider between them.
- Final view of the dashboard is 900x700.
Phew… I had my share of fun with trellis chart in the last Workout Wednesday. But this looked interesting and more challenging.
Before starting, as suggested by Andy, I read the blogs, part - 1, 2, and 3 by Chris love . They were a huge help and significantly enhanced my knowledge on on size(), Index() and trellis chart explanation.
Easy things first, I started with creating parameters for chosing a dimension and the date level and their respective table calculations to select them on view.
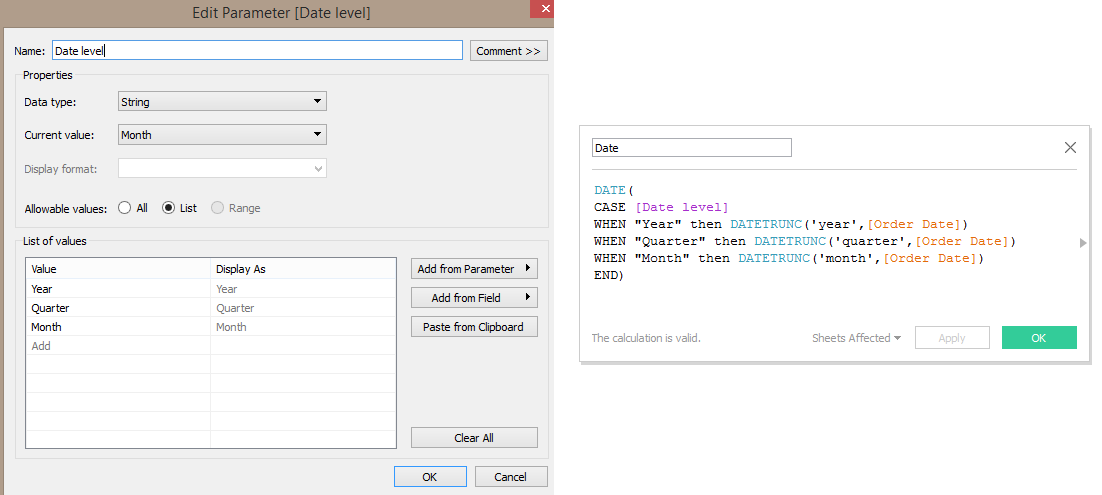
The date calculation is truncating the specific part of the order date depending on what we have chosen in the parameter and then wrapping it in date so that final result comes in date format and not in string or integer format.
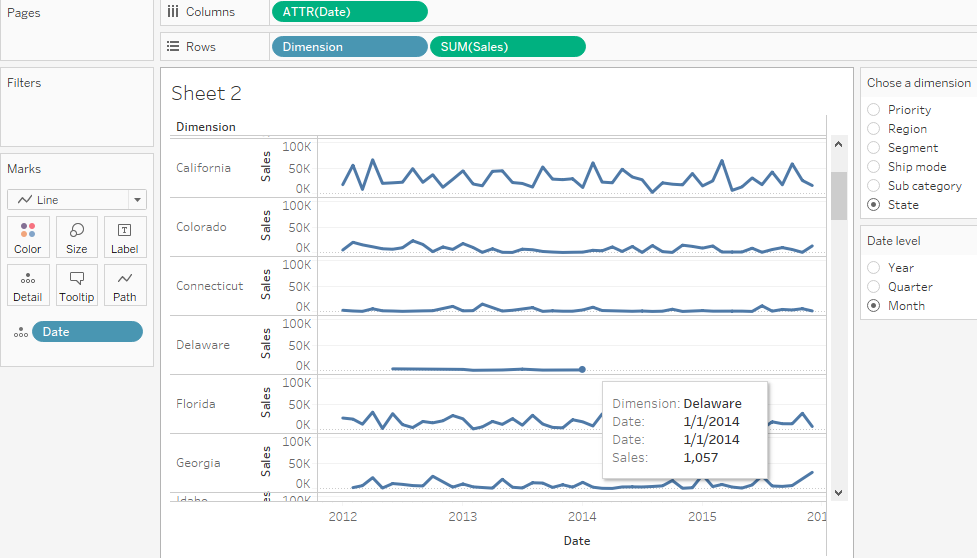
Then I plotted sum(sales) against “Dimension” and “Date” fields. I put in the date field as continuous year but the Date level parameter and the date on the column shelf were not in sync. Data was showing as per the Date on column shelf and not as per the parameter. Things got messy when I put date on detail shelf as a continuous measure. This led to some investigation which helped a lot in understanding about Table Calculations and date calculations.
The main reason behind the issue was incorrect aggregation of date field.
Finally the issue with date view and its aggregation was resolved with the following changes:
- Date on the detail shelf is set to discrete and Exact date so that it picks up all the data points at row level(of data), without any aggregation.
- Date on the column shelf is set to continuous date to get a continuous line in-spite of missing data for some time periods, and aggregated at ATTR() to get unique mark for every date level selected.
- Data will now be filtered as per selection in the Date level parameter.
To summarise - pick the data at exact date level, aggregate them at “Date level” and show it as a continuous line:
Now the graph is ready and next step is to put it in trellis format. The calculation from last post came handy to achieve the trellis format:
Well, with these calculuation things went berserk which led to detailed investigation of addressing and partitioning. This incredibly awesome blog by Jonathan Drummey helped a lot in understanding “Compute Using” and “At the Level”.
A must read!
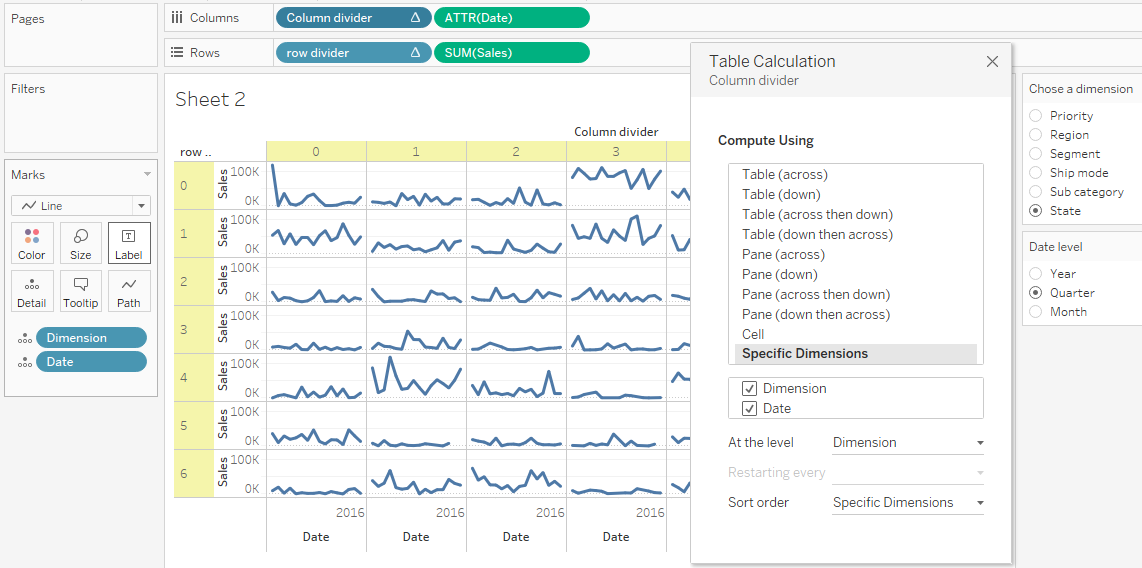
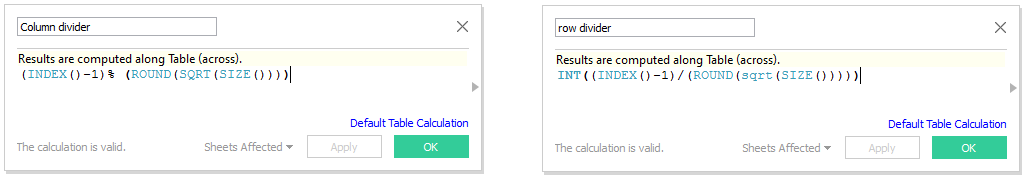
For edit table calculation of column and row divider:
- when we set compute using to Dimension and Date then the marks are created at the level of combination of these two fields.
- when we set “At the level” to Dimension then the index() and size() calculation works at the level of Dimension. These generated indexes are now used for calculating and allocating the respective marks of data in the trellis grid.
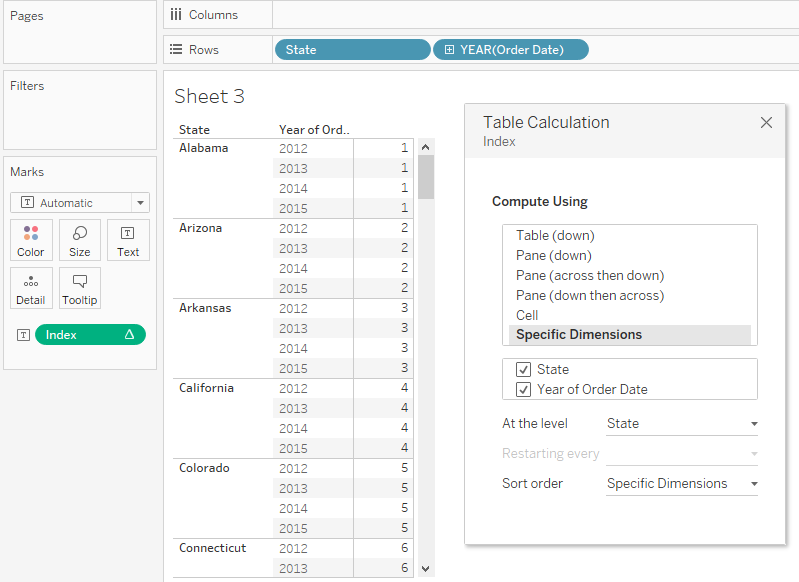
An illustrative example of the index() computation:
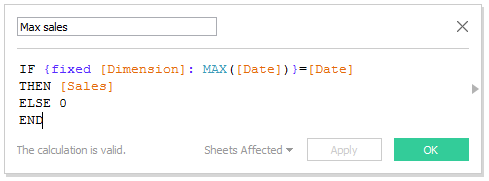
To display sales value in the most recent period, we just put the Sum(Sales) on Labels mark and set it to show only the recent value. This also gives a small dot at the end. Also set the label color to match the mark color.
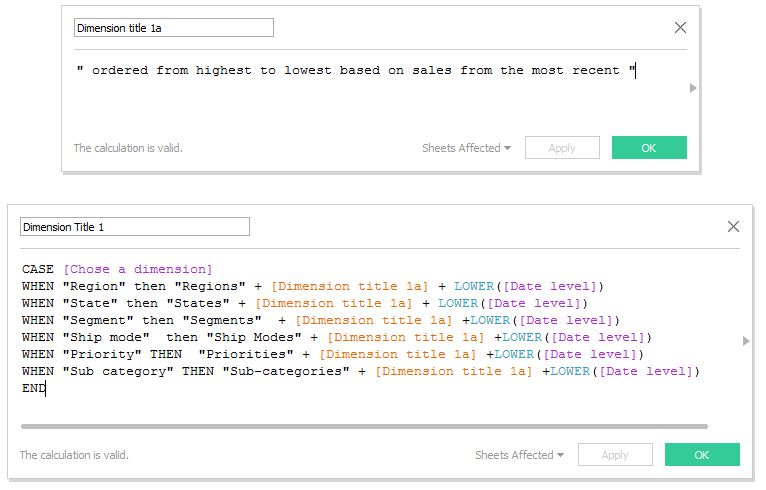
To calculate the sales value in the most recent period, I used LOD calculation fixed at Dimension. This is then used to sort the Dimension pill in the details shelf which now orders the dimension from highest to lowest based on sales from the most recent period.
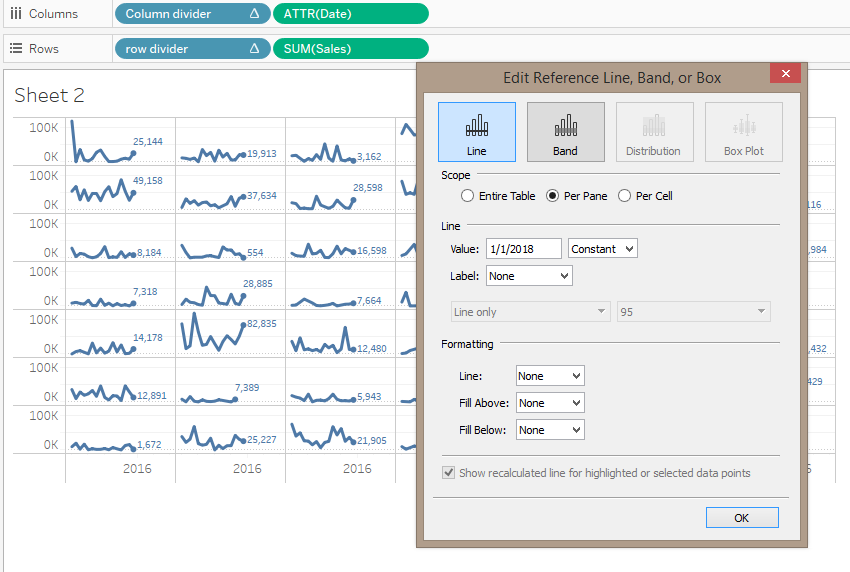
Now comes the part where we have to give some breathing space to the lables so that they are aligned to the right of the line chart. To do this, since the axis was always showing “Year” with values from 2012 to 2015 irrespective of whether “Date level” was chosen as month or quarter, I added a constant reference line at 2018 and got the desired result.
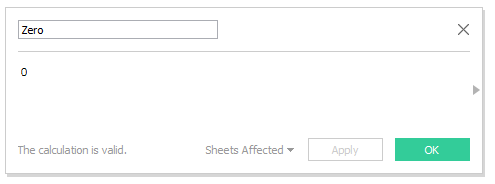
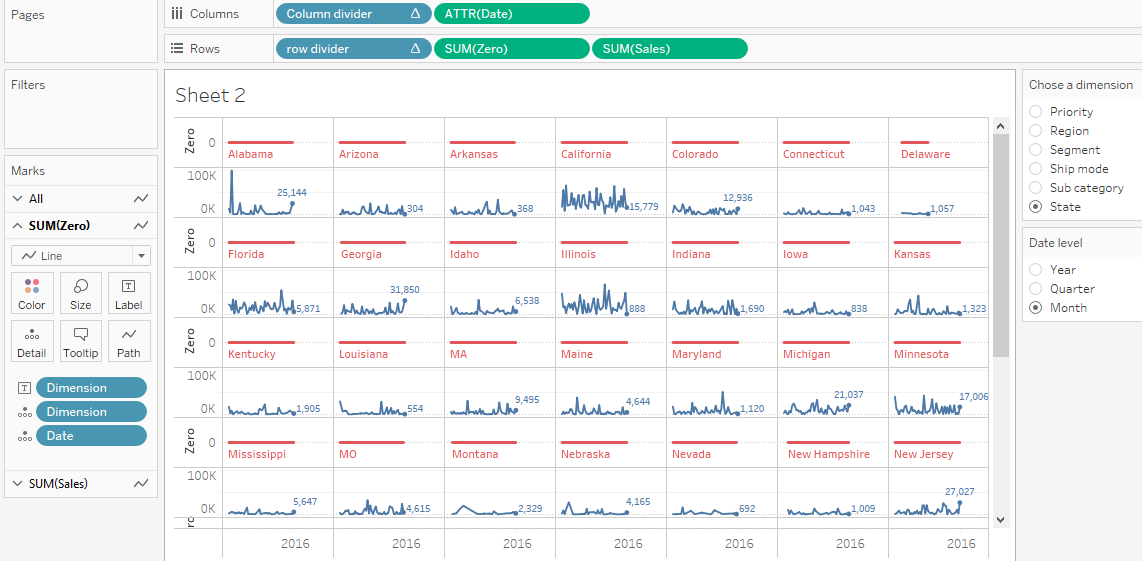
Now to show the dimension as labels above each chart we can’t directly put the Dimension pill on Labels because Tableau will label the ends of the chart, but we want it in the middle of the chart. Since that would have involved calculating the middle point of the axis and placing the label there, it sounded like too much work. So I opted to show the labels left aligned. To do that I created a dummy variable Zero which is nothing but a zero and placed it on the row shelf before Sum(sales) so that it created additional space on the y axis .
Now, just Add the Dimension pill to its Label and Voila…. When we reduce the opacity of the line to zero it gives us only the Dimension name as label.
At last we need tooltips and dynamic heading.
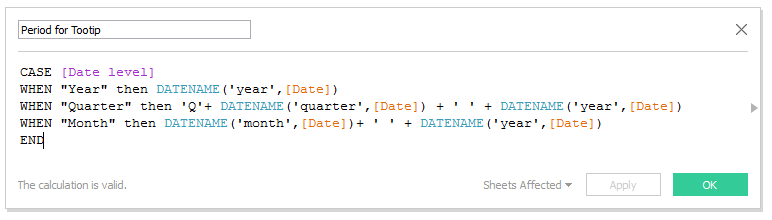
A simple calculation of extracting the Datename of year, quarter and month from the Date field gave us the required tooltips.
Also for heading, apart from taking input from the parameters, we also need to show selected dimension in their plural form and the selected date in lower case.
After doing necessary formatting and removing the grid lines, the final dashboard is as below. (Click on the image to view the interactive version)
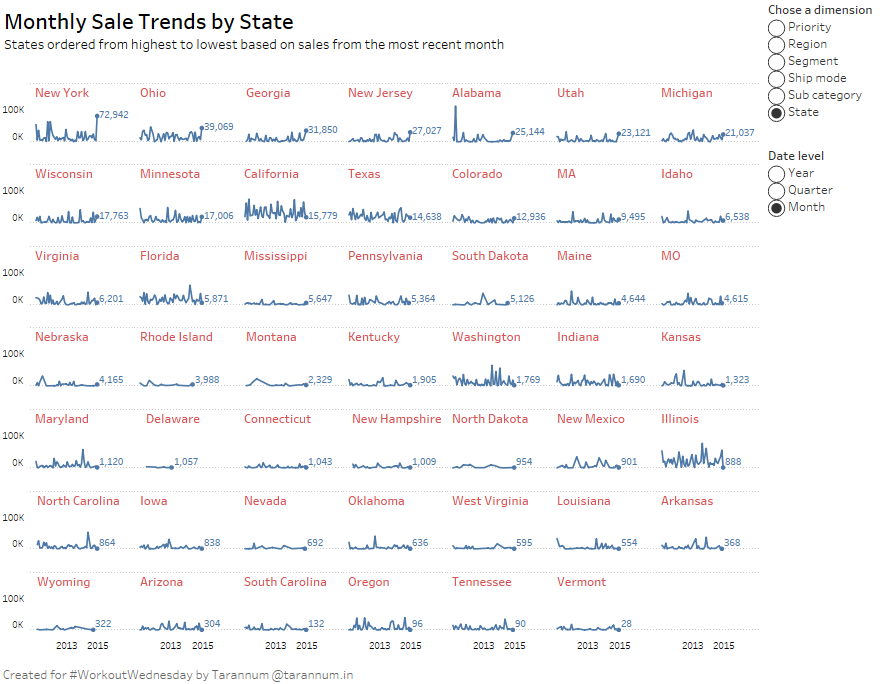
tableau WorkoutWednesday trellis-chart