Workout Wednesday Week 6 - Butterfly bar chart in Trellis format
tableau WorkoutWednesday trellis-chart butterfly-chart
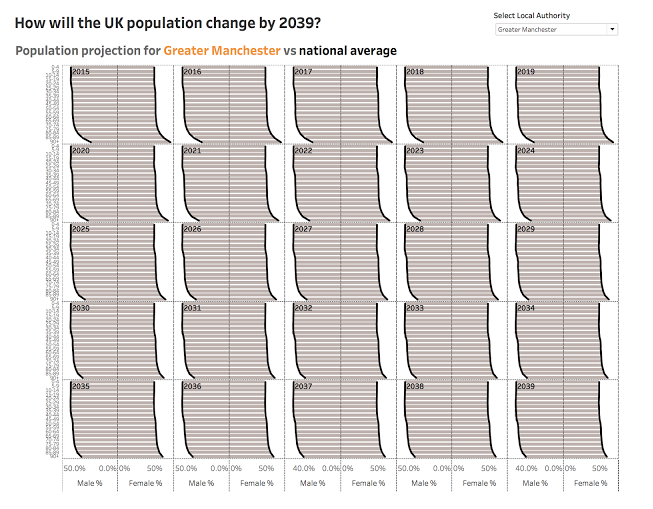
This week’s Workout Wednesday was given by Emma Whyte (@EmmaWhyte). The challenge was to recreate the below viz using UK population data from the ONS website
####Some info about the viz:####
Each part of the trellis is a year, from 2015-2039. Each side of the butterfly is either the percentage of males or females by age group. The black line is the national average, the bars are the percentage for the local authority you have selected. The aim of this chart was to give the user an indication of whether the percentage of males or females in their local area was on par with the national average; how this changes over time; and if there were any age groups that were either more female or male.
####Some rules for re-creating this viz:####
- Remove the year 2014 (to create an even trellis)
- Filter the original data to remove the local authority ‘England’ and the age group ‘all ages’ (these are unnecessary total lines in the data)
- Pull out male and female population numbers, then make them percentages
- Find out the national average for males and females
- Be able to filter to one local authority at a time (not select all - this makes for a messy & slow viz!)
- Display a label on each trellis part for the year
- The sheet title should change depending on the local authority you select
- My dashboard size is 1000x800 pixels
- Font: Tableau Bold for the titles and then Tableau Book for all other text
- Format the chart lines to be dashes
####Initial thoughts:####
It was my first time preparing trellis chart so I was pretty excited.
####Things which seem easy at this point:####
- The calculations for populations % looked simple enough.
- Formatting, labeling and filtering looks pretty doable
- For the national average line LOD calculation at year and age level should be sufficient
####Things not so easy:####
- I had no idea how to divide the viz into columns and rows so would have to look at some tutorial for that
With these thoughts I loaded up the data extract provided by Emma. I chose to use .tde extract this time to see how they are used. I have only used excel sheets till now. since .tde came with filtered and manipulated data, it was quite easy to use.
To begin with I looked for some tutorial on trellis chart and got this post by Andy Kriebel which helped in understanding how to divide columns and rows in trellis chart.
####These are the calculations which we use to divide the columns and rows:####
Column Divider:
Row Divider
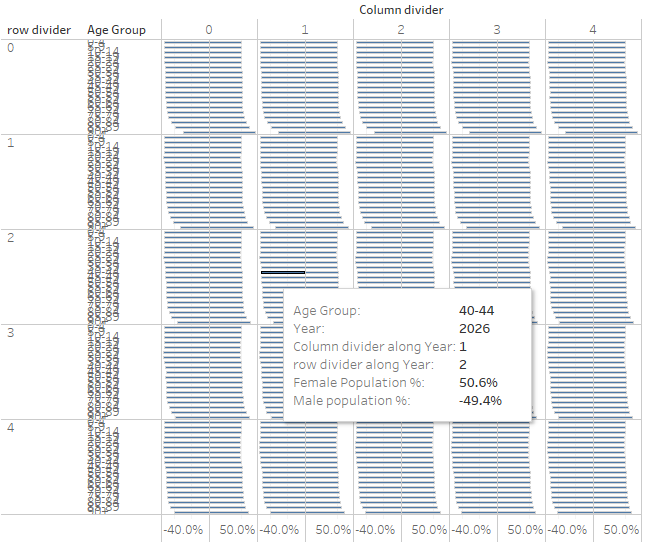
The calculations worked perfectly when we used “compute with” set to year after putting “column divider” on column shelf and “row divider” on row shelf. But I couldn’t really wrap my head around the calculation. What exactly was it doing? why subtracting 1 from Index()? why a modulus in column and division in rows? So I dig in a little and this is what I understood
What we want is to divide the total entities (in our case: 25 years) as evenly as possible in rows and columns like a matrix. We need a way to tell each entity to go to a specific cell in the matrix lets say 4th column and 5th row. specifically, we need to assign every entity a row number and a column number
So this is what we need to do:
- take total number of entities to be placed in the matrix (Size()=25)
- now to get symmetric distribution, we should have equal number of rows and columns lets say “n”.Thus total entities should be n rows n columns which is . Now if we have total entities = T, then , which gives us . Thus we need to take square root of total entities to get number of rows and columns.
- round it to the nearest integer (If total entities were 27 then square root would be 5.19 which on rounding will become 5)
- subtract 1 from Index() to get the first index as 0 as the index() gives 1 by default but tableau starts placing items starting from index 0.
For columns now:
Col index for entity:
Col index for entity:
Col index for entity:
Col index for entity:
Col index for entity:
Col index for entity:
Col index for entity:
and so on. this way we have 5 columns from 0 to 4.
For rows:
Row index for entity:
Row index for entity:
Row index for entity:
Row index for entity:
Row index for entity:
Row index for entity:
Row index for entity:
and so on.
This way after every five entities the row number is changing. Here, INT( ) is cleverly being used to round off the number to closest integer towards zero. This can also be achieved by Floor() which rounds a number to the nearest integer of equal or lesser value.
This gave us the desired result of distributing the entities in rows and columns.
Once I understood this the rest of the calculations were pretty straightforward.
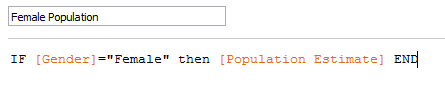
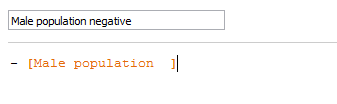
First calculating the male and female population numbers
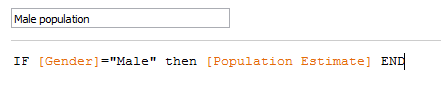
Since I wanted to plot male population on the reverse axis I also calculated a negative of male population.
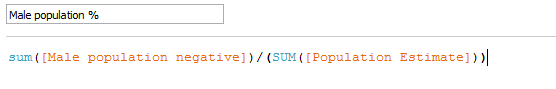
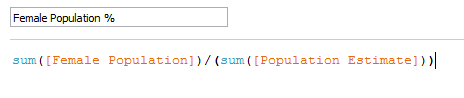
Then calculating their percent out of total population
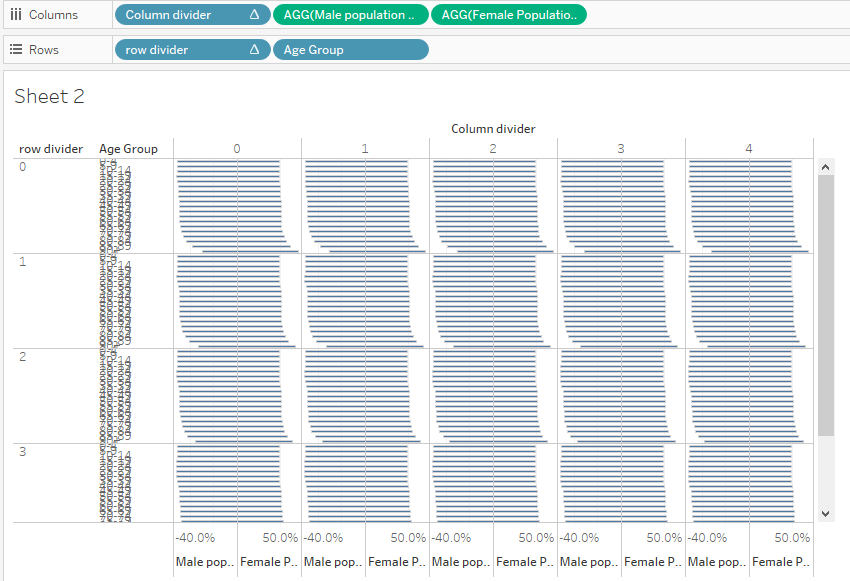
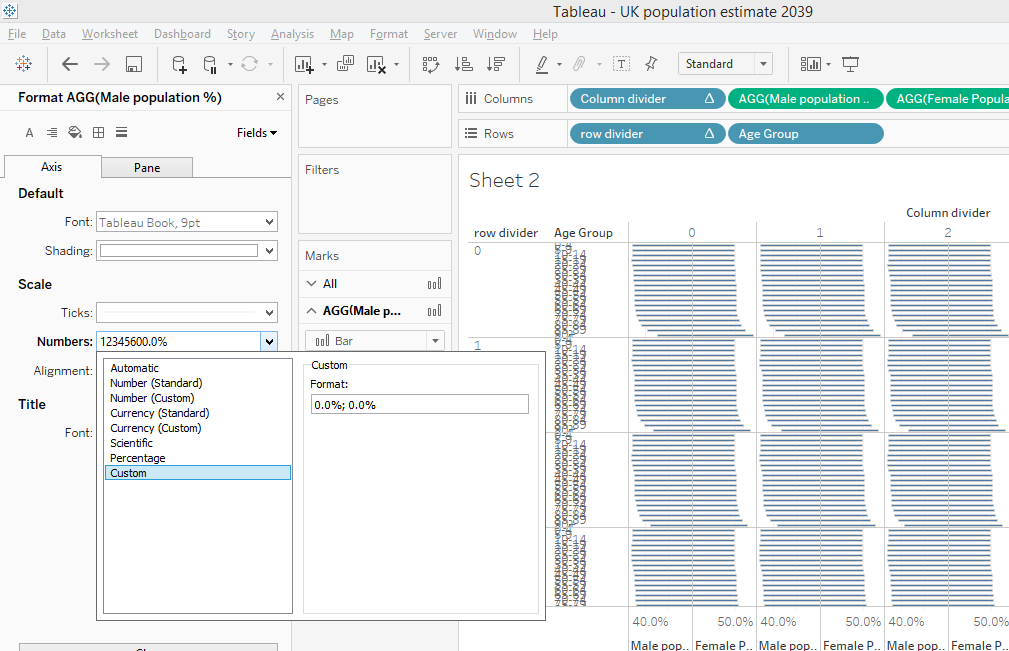
I arrived here by plotting the above numbers.
To get rid of the negative sign in the male population axis, I formatted it to show negative numbers as positive.
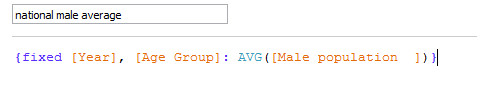
Then I calculated the national averages by LOD calculation by fixing the year and age group
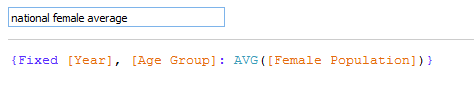
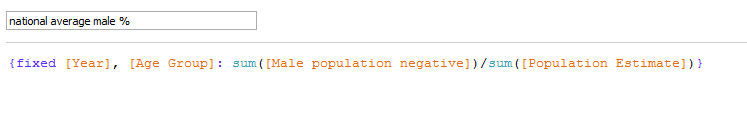
Also, the national average percent out of total the same way

I plotted the national averages on as dual axis and changed the marks type to line. Also as suggested by Andy, I highlighted the bars to show different colors for values above and below the national averages. I couldnt put the year labels as recommended by Emma so I just placed them where they looked fine.
This is the final dashboard. (Click on the image to view the interactive version)
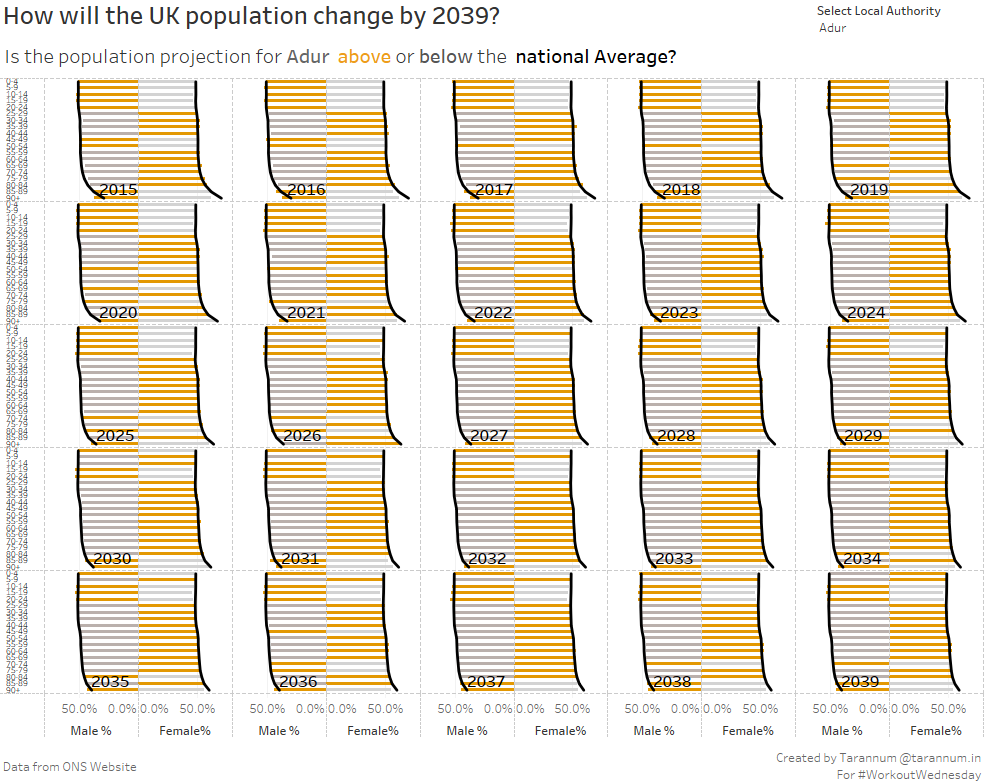
tableau WorkoutWednesday trellis-chart butterfly-chart